Google Ads for B2B: Why You Need a 90-Day Measurement Window
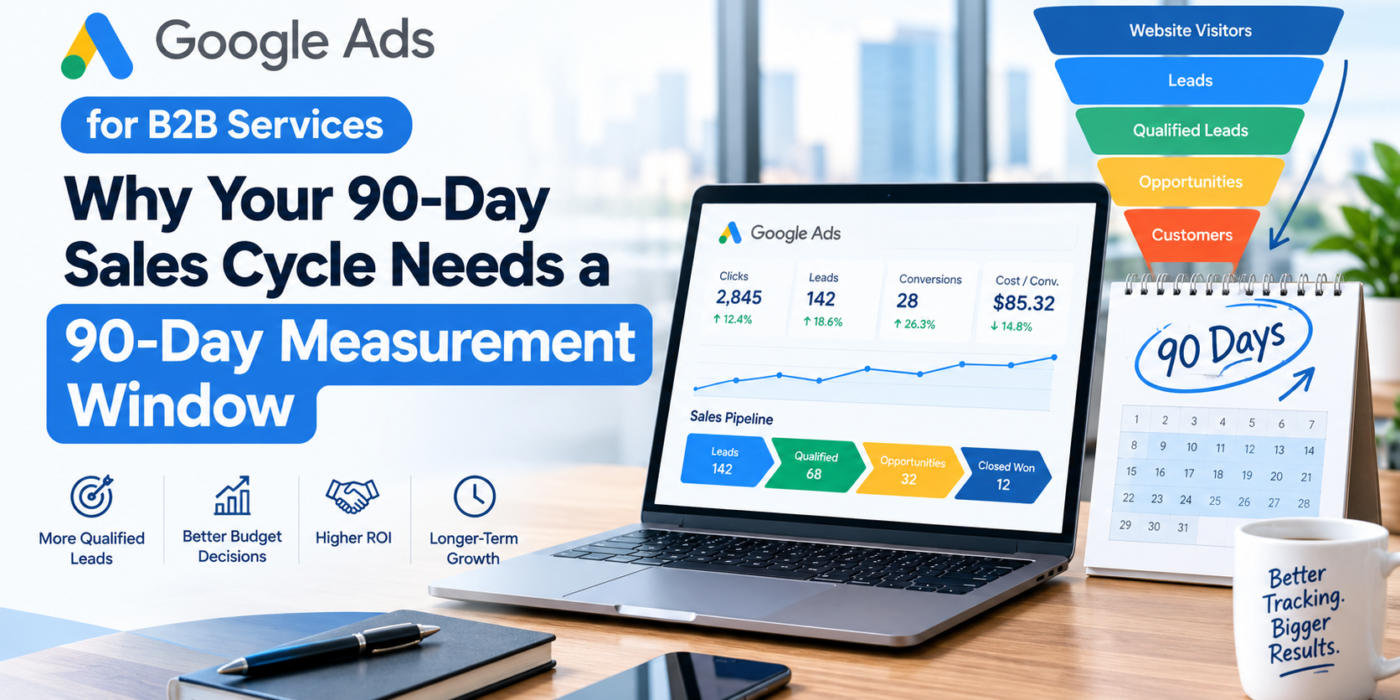
Google Ads for B2B Services: Why Your 90-Day Sales Cycle Needs a 90-Day Measurement Window

Introduction: Why B2B Google Ads Requires a Different Measurement Approach
Google Ads can be a powerful growth channel for B2B service businesses. It allows companies to reach potential customers who are actively searching for solutions, compare service providers, and generate qualified leads from people with genuine commercial intent.
However, B2B advertising is rarely a simple journey from clicking an ad to becoming a customer.
A prospect might click your ad today, read your website content tomorrow, download a case study next week, schedule a discovery call two weeks later, request a proposal after a month, and finally sign a contract 90 days—or even longer—after the original interaction.
This creates a significant challenge for marketers.
If you evaluate your Google Ads campaigns after only seven, 14, or 30 days, you may conclude that a campaign is underperforming when it is actually generating valuable opportunities that have not yet converted into revenue.
For B2B companies with an average sales cycle of approximately 90 days, measurement should reflect that reality.
Your reporting window should be long enough to capture the customer journey, not just the first conversion.
A 90-day measurement window gives marketers more time to evaluate lead quality, understand pipeline progression, identify revenue opportunities, and make informed budget decisions.
In this guide, we will explore why B2B sales cycles are longer, why short measurement windows can lead to costly mistakes, how to implement a 90-day measurement framework, and which metrics matter most when evaluating Google Ads performance.
1. Why B2B Sales Cycles Are Longer Than B2C Sales Cycles

In many business-to-consumer transactions, the buying process can be relatively short. A customer searches for a product, compares a few options, and makes a purchase within minutes or days.
B2B services are different.
Businesses often make purchasing decisions involving larger budgets, multiple stakeholders, operational risks, and long-term commitments. Buyers need time to research providers, evaluate capabilities, compare proposals, and secure internal approval.
For example, consider a company searching for a Google Ads management agency.
The process might look like this:
- Days 1–14: The company researches PPC agencies and clicks relevant Google Ads.
- Days 15–30: The marketing manager reviews websites, case studies, pricing, and testimonials.
- Days 31–45: The company schedules discovery calls and shortlists providers.
- Days 46–60: Decision-makers evaluate proposals and expected returns.
- Days 61–75: The company discusses pricing, contracts, and onboarding requirements.
- Days 76–90: The final provider is selected and the contract is signed.
This timeline is illustrative rather than a universal benchmark. Some businesses close much faster, while enterprise deals may take six months or longer.
The important point is that the original ad click may happen well before the final sale.
Factors that extend B2B sales cycles
Several factors contribute to longer sales cycles:
Multiple decision-makers: A marketing manager might identify a service provider, but the final decision could involve the CEO, finance department, procurement team, or other stakeholders.
Higher purchase value: Expensive services generally require more scrutiny because the financial consequences of choosing the wrong provider are greater.
Complex solutions: Services such as cybersecurity, enterprise software implementation, consulting, and digital transformation often require detailed assessments before a purchase.
Internal approval processes: Even when a buyer is ready, budget approval, contract review, and procurement procedures can delay the decision.
Trust and credibility: Businesses need confidence that a provider can deliver the promised results. Case studies, references, consultations, and demonstrations all take time.
These factors make it essential to evaluate Google Ads against the actual B2B buying journey.
2. What Is a 90-Day Measurement Window?
A 90-day measurement window is an evaluation period used to observe how advertising-generated leads progress through the sales pipeline over approximately three months.
Rather than judging campaign success exclusively by immediate conversions, marketers monitor the journey from the initial interaction to qualification, opportunity creation, and—where sufficient time has passed—a closed deal.
Consider a campaign that generates 40 leads during October.
At the end of October, only three may have become qualified opportunities. A short-term report might suggest disappointing performance.
By the end of November, however, some of those leads may have booked consultations, received proposals, or entered negotiations.
By the end of January, several may have become customers.
The original campaign’s business contribution can look very different once those leads have had time to progress.
Measurement window versus conversion window
It is important to distinguish two concepts.
- Measurement window: The period over which you evaluate campaign performance, lead progression, and commercial outcomes.
- Google Ads conversion window: The configured period after an eligible ad interaction during which a conversion can be credited to that interaction, subject to the conversion action’s settings and attribution rules.
These are not the same thing.
A 90-day reporting period does not automatically mean every Google Ads conversion action should be configured with a 90-day conversion window. Available settings depend on the conversion action and Google’s current product rules.
Instead, use your sales-cycle data to determine the appropriate evaluation period, and configure conversion tracking according to the specific customer journey and platform settings.
3. The Problem With Measuring Google Ads Too Early
Many businesses evaluate paid advertising using the first seven, 14, or 30 days of performance. Although short-term reporting is useful for identifying technical problems and early trends, it can be misleading when used to judge the full commercial value of a B2B campaign.
Here are four common problems.
3.1 You may pause campaigns that are generating valuable leads
Imagine you spend $3,000 on a Google Ads campaign and generate 20 leads.
At the end of the first month, only two leads have become qualified sales opportunities. You may decide that the campaign is not working and reduce its budget.
However, the remaining leads might still be researching your service, arranging meetings, or seeking internal approval.
Over the next two months, several of those leads could become customers.
If you stop the campaign prematurely, you may lose access to a source of profitable opportunities before its value becomes clear.
3.2 You may prioritize cheap leads over qualified prospects
A campaign generating inexpensive leads is not necessarily a good campaign.
Consider two hypothetical campaigns:
| Metric | Campaign A | Campaign B |
|---|---|---|
| Ad spend | $3,000 | $3,000 |
| Leads generated | 60 | 25 |
| Cost per lead | $50 | $120 |
| Qualified leads | 6 | 10 |
| Cost per qualified lead | $500 | $300 |
Campaign A generates more leads at a lower cost per lead. However, Campaign B generates more qualified prospects for the same advertising budget.
If you optimize exclusively for lead volume and CPL, you may mistakenly favor Campaign A.
A longer measurement window helps reveal which campaign contributes more meaningfully to your pipeline.
3.3 You may underestimate return on ad spend
Revenue frequently arrives weeks or months after an advertising interaction.
When a customer signs a contract in December after clicking an ad in October, an October report based only on closed revenue might not show the full contribution of that lead cohort.
This can make campaigns look less profitable than they ultimately prove to be.
The solution is to track leads and opportunities over time, connect sales outcomes to advertising data where possible, and revisit historical performance as more outcomes become available.
3.4 You may make unnecessary budget changes
Frequent budget changes based on immature data can make campaign management reactive.
You might reduce spending on a promising campaign, move money into a campaign producing low-quality leads, or make major bidding changes before sufficient conversion data is available.
This does not mean marketers should ignore poor performance for 90 days. It means decisions should reflect the type and maturity of the evidence available.
Fix obvious problems immediately. Use a longer evaluation period to judge outcomes that naturally take time to materialize.
4. Why a 90-Day Measurement Window Makes Sense for B2B

When your average sales cycle is around 90 days, a three-month evaluation framework can help align advertising analysis with business reality.
Here are the main benefits.
4.1 More accurate lead-quality assessment
Initial form submissions provide only a limited view of campaign performance.
A prospect might download a resource without having purchasing authority or a real need for your service. Another prospect might request a consultation and become a valuable customer after several weeks of evaluation.
By tracking qualification and sales progression, you can identify which campaigns attract serious buyers rather than simply generating activity.
4.2 Better budget allocation
When you understand which campaigns create qualified opportunities and customers, you can allocate budgets more intelligently.
For example, a high-intent search campaign might generate fewer leads than a broad campaign, but its leads may progress to sales opportunities at a much higher rate.
A longer measurement period helps you recognize this difference and allocate spending based on business value rather than lead volume alone.
4.3 Better bidding decisions
Automated bidding strategies rely on conversion signals to help optimize delivery.
If the conversion actions you provide primarily represent low-quality inquiries, the system may pursue more of those actions rather than the downstream outcomes your business actually values.
Where your tracking setup, conversion volume, and business processes support it, importing qualified leads or other meaningful offline outcomes can help align optimization with sales quality.
Do not assume that simply waiting 90 days improves automated bidding. The value comes from collecting accurate signals, using appropriate conversion goals, and making decisions based on reliable data.
4.4 More meaningful ROI analysis
A longer evaluation period can help connect campaign costs to qualified pipeline and eventual sales.
This is especially important for businesses selling recurring retainers, enterprise services, consulting engagements, or high-value contracts.
However, distinguish carefully between:
- Lead value
- Estimated pipeline value
- Signed contract value
- Recognized revenue
- Gross profit
These are different measures. A large opportunity in the CRM is not the same as realized revenue.
4.5 Improved collaboration between marketing and sales
A 90-day framework encourages marketing and sales teams to evaluate performance together.
Marketing can explain where leads originated, while sales can report qualification, objections, opportunity stages, and reasons for lost deals.
This shared view makes it easier to identify whether the problem lies in advertising traffic, the offer, the landing page, lead handling, pricing, or the sales process.
5. Which Metrics Should You Track Over 90 Days?
The best measurement framework follows the entire journey, from initial advertising activity to commercial outcomes.
Stage 1: Advertising performance
Monitor spend, impressions, clicks, search terms, click-through rate, and landing-page engagement.
Stage 2: Lead generation
Track valid inquiries, calls, booked meetings, form completion rate, and cost per lead.
Stage 3: Qualification
Measure qualified leads, sales acceptance, disqualification reasons, and cost per qualified lead.
Stage 4: Sales pipeline
Track opportunities created, proposals sent, deal progression, and pipeline value.
Stage 5: Commercial outcomes
Evaluate closed-won deals, customer acquisition cost, revenue, gross profit, and return on ad spend where reliable data is available.
The most important B2B Google Ads KPIs
Cost per lead (CPL): How much you spend to generate an inquiry. Useful for understanding acquisition efficiency, but insufficient on its own.
Cost per qualified lead: How much advertising spend is required to generate a lead that meets your agreed qualification criteria.
Lead-to-opportunity rate: The percentage of leads that become genuine sales opportunities.
Cost per opportunity: Advertising spend divided by the number of sales-qualified opportunities generated.
Lead-to-customer rate: The percentage of leads that eventually become customers. Make sure you account for leads that have not had enough time to mature.
Customer acquisition cost (CAC): The cost of acquiring a new customer. Clearly define whether this includes advertising only or also sales salaries, agency fees, software, and other acquisition expenses.
Return on ad spend (ROAS): Attributable revenue divided by advertising spend. For B2B services, specify whether you are measuring signed contract value or recognized revenue.
A campaign with a higher CPL may still be more profitable if it generates customers with larger contracts, better retention, or stronger margins.
The objective is not to minimize every individual metric. It is to generate commercially valuable customers at an economically sustainable cost.
6. How to Set Up a 90-Day Google Ads Measurement Framework
A longer reporting window only helps if your tracking and CRM processes are reliable. Use the following steps to build a framework that connects paid media to real business outcomes.
Step 1: Define your conversion stages
Start by agreeing on what each stage means.
For example:
- Lead: A person submits a valid inquiry or contacts your business.
- Marketing-qualified lead (MQL): The lead meets your initial fit and intent criteria.
- Sales-qualified lead (SQL): Sales confirms that the prospect is worth pursuing.
- Opportunity: A legitimate potential deal is recorded in the CRM.
- Closed-won: The prospect becomes a paying customer.
Not every business needs all these stages, but each stage you use should have a clear definition.
Step 2: Audit your conversion tracking
Before increasing spending, confirm that Google Ads and your analytics tools are recording the actions that matter.
Review:
- Contact and quote-request forms
- Consultation bookings
- Phone calls
- Thank-you page events
- Duplicate conversion events
- CRM lead creation and qualification
- Consent settings and relevant privacy requirements
Test the complete journey rather than assuming tracking works because a conversion appears in a dashboard.
Step 3: Connect Google Ads to your CRM
Your CRM should preserve the information needed to understand where leads originated and how they progress.
Depending on your setup, this may include campaign and source details, landing-page information, timestamps, and eligible advertising click identifiers.
Keep your tracking conventions consistent, and follow applicable privacy, consent, data-retention, and platform requirements.
When properly implemented, this information can help you understand whether Google Ads leads become qualified opportunities and customers.
Step 4: Import offline conversions where appropriate
Many valuable B2B outcomes occur outside the website.
A lead may become qualified after a sales call, enter an opportunity stage in the CRM, or sign a contract through an offline process.
Offline conversion imports and enhanced conversions for leads can help connect eligible downstream outcomes with advertising interactions when supported by your configuration.
The practical advantage is that Google Ads can potentially receive more meaningful signals than a basic form submission alone.
Implementation requires careful configuration, appropriate identifiers, accurate timestamps, and compliance with Google’s current requirements. Not every CRM or tracking setup supports every option.
Step 5: Build a cohort-based reporting dashboard
A cohort is a group of leads acquired during the same period.
For example, you could create monthly cohorts for October, November, and December, then follow each group through the sales pipeline.
A simple dashboard might look like this:
| KPI | October cohort | November cohort | December cohort |
|---|---|---|---|
| Leads generated | 40 | 45 | 50 |
| Qualified leads | 16 | 18 | 17 |
| Opportunities | 8 | 9 | 6 |
| Closed-won deals | 3 | Pending | Pending |
Illustrative data only. The cohorts have different maturity levels, so their final results should not be compared without accounting for the time each has had to progress.
This approach prevents you from treating a recently acquired lead as a failure simply because it has not closed yet.
Step 6: Separate leading indicators from final outcomes
You do not need to wait 90 days to learn anything useful.
Leading indicators include search-term relevance, click quality, landing-page performance, valid leads, and qualification rates.
Lagging indicators include closed-won deals, actual revenue, customer acquisition cost, and profit.
Use leading indicators to diagnose problems early. Use mature downstream outcomes to evaluate commercial success.
Step 7: Establish decision rules before the campaign launches
Agree in advance on which findings require immediate action and which need more evidence.
For example, broken tracking, irrelevant search traffic, and repeated spam submissions should be addressed quickly.
However, a campaign that has generated several qualified opportunities but no closed deals after 20 days should not automatically be declared unsuccessful if the normal sales cycle is three months.
This approach makes optimization more disciplined and less reactive.
7. Your Practical 30/60/90-Day Review Plan

A structured review schedule gives your team checkpoints without confusing early indicators with final results.
Days 1–30: Validate tracking and lead quality
Your priorities should be:
- Confirm that campaigns target relevant searches and audiences.
- Check that conversion tracking works correctly.
- Review search terms, ads, and landing pages.
- Confirm that sales receives inquiries promptly.
- Identify invalid leads, spam, and obvious mismatches.
- Establish baseline CPL and qualification rates.
At this stage, focus on whether the campaign is attracting relevant traffic and producing measurable activity.
Avoid making confident revenue predictions from limited data.
Days 31–60: Evaluate pipeline progression
By the second month, some leads should have progressed into meaningful sales conversations.
Review:
- Qualified leads and sales acceptance
- Consultation bookings and completed meetings
- Opportunity creation
- Proposal requests
- Sales feedback and objections
- Cost per qualified lead
- Differences between campaigns and keyword groups
Use these findings to improve targeting, ad messaging, landing pages, and lead qualification.
Continue monitoring younger leads separately from older ones.
Days 61–90: Evaluate mature business outcomes
By the third month, the earliest leads may have had enough time to become customers.
Review:
- Closed-won deals
- Cost per opportunity
- Customer acquisition cost
- Attributable revenue
- Contract value and gross profit
- Lead-to-customer conversion rate
- Campaign-level contribution to pipeline
Decide which campaigns deserve more investment, which require refinement, and which are consistently failing to produce meaningful results.
Remember that a campaign’s maturity depends on the actual sales cycle and the number of observations available. Ninety days is not a guarantee that every deal will have closed.
What happens after day 90?
Continue tracking leads that remain active.
If your average sales cycle is 120 or 180 days, extend the observation period accordingly. Use qualification, opportunity creation, and deal-stage progression as interim indicators while waiting for final outcomes.
The right measurement window is the one that reflects your customers’ real buying behavior.
8. How to Calculate the True Value of Your B2B Google Ads Campaigns
Understanding the right formulas helps you move beyond surface-level metrics.
Cost per lead
\[ \text{CPL}=\frac{\text{Advertising Spend}}{\text{Total Leads}} \]
If you spend $3,000 and generate 30 leads, your CPL is $100.
Cost per qualified lead
\[ \text{CPQL}=\frac{\text{Advertising Spend}}{\text{Qualified Leads}} \]
If those 30 leads include 10 qualified prospects, your cost per qualified lead is $300.
Cost per customer
\[ \text{Cost per Customer}=\frac{\text{Advertising Spend}}{\text{New Customers}} \]
If the campaign ultimately generates three customers from $3,000 in ad spend, the ad-only acquisition cost is $1,000 per customer.
This calculation should use a clearly defined cohort and enough time for its results to mature.
Return on ad spend
\[ \text{ROAS}=\frac{\text{Attributable Revenue}}{\text{Advertising Spend}} \]
If $3,000 in advertising spend is associated with $15,000 in attributable revenue, the ROAS is 5:1.
For B2B services, however, be precise about the revenue figure. Signed contract value, recognized revenue, estimated pipeline value, and gross profit are not interchangeable.
For a business selling annual retainers, a signed contract may represent revenue delivered over many months. Your reporting should clearly state what is being measured and avoid counting estimated pipeline as actual sales.
9. Common Mistakes to Avoid When Measuring B2B Google Ads
Even experienced advertisers can misinterpret long-cycle campaigns if their reporting process is not designed for B2B.
Mistake 1: Optimizing exclusively for form submissions. A form submission is a useful signal, but it does not establish that the person is qualified or likely to buy.
Mistake 2: Comparing cohorts of different ages. A lead acquired five days ago has had less time to progress than one acquired 80 days ago. Account for this difference.
Mistake 3: Making dramatic budget changes based on small samples. A few early conversions may not be representative of long-term performance. Consider the number and quality of outcomes before making major decisions.
Mistake 4: Ignoring sales-team feedback. Sales can reveal whether leads have real budgets, decision-making authority, a clear business need, and realistic purchase timelines.
Mistake 5: Treating pipeline value as revenue. Opportunities represent potential business, not guaranteed income. Report pipeline and closed revenue separately.
Mistake 6: Confusing the reporting window with the Google Ads conversion window. The former describes your evaluation period; the latter determines eligible conversion attribution under the relevant platform settings.
Mistake 7: Ignoring the contribution of earlier interactions. A prospect may interact with several ads, organic search results, referrals, and other channels before purchasing. Use a consistent attribution approach, and acknowledge its limitations.
Mistake 8: Waiting 90 days to fix obvious problems. Long sales cycles are not an excuse to tolerate broken tracking, irrelevant traffic, slow lead response, or a dysfunctional landing page.
10. How to Improve Your 90-Day Measurement Strategy
Once your tracking foundation is in place, these practices can make your reporting more useful.
Align marketing and sales goals
Marketing should not be evaluated exclusively on lead volume if the business ultimately needs qualified opportunities and profitable customers.
Agree on shared KPIs, qualification standards, and reporting responsibilities with sales.
Improve lead response times
Even an excellent advertising campaign can underperform if inquiries are not handled promptly.
Establish a process for assigning new leads, following up, recording sales activity, and updating CRM stages.
Segment campaigns by intent
People searching for a provider, comparing agencies, seeking pricing, or researching a general topic may have different levels of purchase intent.
Segment campaigns and analyze downstream performance to identify which search themes generate the most valuable opportunities.
Use landing pages that support longer decisions
B2B buyers often need evidence before they are ready to speak with sales.
Include relevant case studies, service explanations, testimonials, clear pricing information where appropriate, and strong calls to action.
For prospects who are not ready to book a consultation, useful resources can support the next stage of their research.
Document your assumptions
Record the sales-cycle length, conversion definitions, attribution approach, and reporting dates used in your analysis.
This makes comparisons more consistent and helps prevent teams from changing their definition of success whenever results fluctuate.
Frequently Asked Questions
1. Should every B2B Google Ads campaign be measured for exactly 90 days?
No. Ninety days is a practical benchmark when it matches your typical sales cycle. If your business closes deals in 30 days, a shorter evaluation period may be appropriate. If your enterprise sales cycle lasts six months, you may need a longer period.
2. Should I wait 90 days before optimizing my Google Ads campaigns?
No. Review search terms, tracking, lead quality, and landing-page performance continuously. Fix obvious problems immediately. The 90-day framework is intended to help you evaluate downstream business outcomes fairly, not to delay necessary improvements.
3. Does a 90-day measurement window mean I should set my conversion window to 90 days?
No. Your reporting period and Google Ads conversion window serve different purposes. Check the available settings for each conversion action and configure them according to Google’s current requirements and your actual customer journey.
4. What if my campaign generates leads but no sales after 90 days?
Investigate lead quality, sales follow-up, qualification rates, opportunity progression, and your actual sales-cycle length. If deals normally take longer than 90 days, extend your observation period. Do not assume that every open opportunity will eventually close.
5. Which is more important: cost per lead or cost per acquisition?
Both are useful, but they answer different questions. CPL measures the cost of generating inquiries, while customer acquisition cost measures the cost of acquiring customers. For B2B services, cost per qualified lead and cost per opportunity can provide valuable intermediate measures while sales outcomes mature.
6. How can I connect Google Ads leads with closed sales?
Use a CRM to track lead sources and sales stages. Where supported and properly configured, offline conversion imports or enhanced conversions for leads can help connect eligible downstream outcomes to ad interactions. Ensure your implementation follows relevant privacy requirements and Google’s current technical guidance.
7. Can a campaign with a high cost per lead still be profitable?
Yes. A campaign may generate fewer, more qualified leads that become high-value customers. Compare qualification rates, opportunity rates, acquisition costs, contract economics, and profitability instead of judging campaigns solely by CPL.
8. How often should I review B2B Google Ads performance?
Monitor campaign health regularly, review lead quality and pipeline progression at appropriate intervals, and assess commercial outcomes as cohorts mature. Weekly operational reviews and monthly pipeline reviews can work well, with a deeper 90-day evaluation when it matches your sales cycle.
Conclusion: Measure the Full Sales Cycle, Not Just the First Click
Google Ads can generate meaningful growth for B2B service businesses, but evaluating it requires an understanding of how business buyers make decisions.
A lead generated today may not become a qualified opportunity for several weeks. A proposal may take another month to be approved. A contract might be signed long after the original advertising interaction.
If your average sales cycle is approximately 90 days, evaluating campaign success exclusively through the first 7, 14, or 30 days can lead to misleading conclusions and poor budget decisions.
A better approach is to validate tracking and traffic quality early, monitor lead qualification and pipeline progression throughout the journey, and assess revenue and acquisition economics as outcomes become available.
Remember that the 90-day window is a planning framework, not a universal rule. Adapt it to your actual sales-cycle data, use reliable conversion tracking, and continue monitoring deals that take longer to close.
The goal is not simply to generate more leads. It is to understand which advertising investments create qualified opportunities, paying customers, and sustainable business growth.
Give your data enough time to mature, connect marketing with sales, and optimize based on the outcomes that matter to your business.